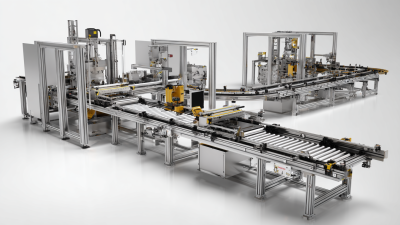
How to Choose the Best Automation Conveyor Systems?
Choosing the right Automation Conveyor Systems starts with understanding how products move through your facility, not with selecting a conveyor from a catalog. Record item dimensions, weight, packaging, and expected production rates. A small carton may travel smoothly on a belt, while irregular or fragile products may need different support. Note where operators load goods, where equipment stops, and where congestion builds during busy shifts. These details help define the real problem. They also prevent a system from being designed around ideal conditions that rarely occur.
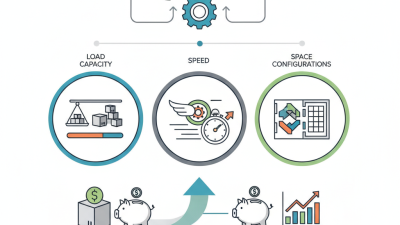
Next, compare conveyor type, layout, controls, and maintenance needs against your operating goals. Measure available floor space, including room for service access and future changes. Check whether accumulation, sorting, elevation, or integration with scanners and production equipment is required. Ask suppliers for clear capacity assumptions, layout drawings, safety features, and maintenance requirements. Where possible, review a similar installation or test representative products before committing. It is easy to overvalue speed. A faster line may simply move a bottleneck downstream.
Total cost matters, but the lowest initial quote may not reflect energy use, replacement parts, downtime, or staff training. Small details count. A poorly placed transfer point can cause repeated jams; an awkward access panel can turn routine service into a longer task. Still, forecasts are imperfect, and actual product mixes often change. Treat selection as an engineering decision that can be revisited, not a one-time shopping exercise. The best system is the one that reliably fits your products, people, space, and changing workload.
Define the Load, Route, Duty Cycle, and Peak Throughput Requirements
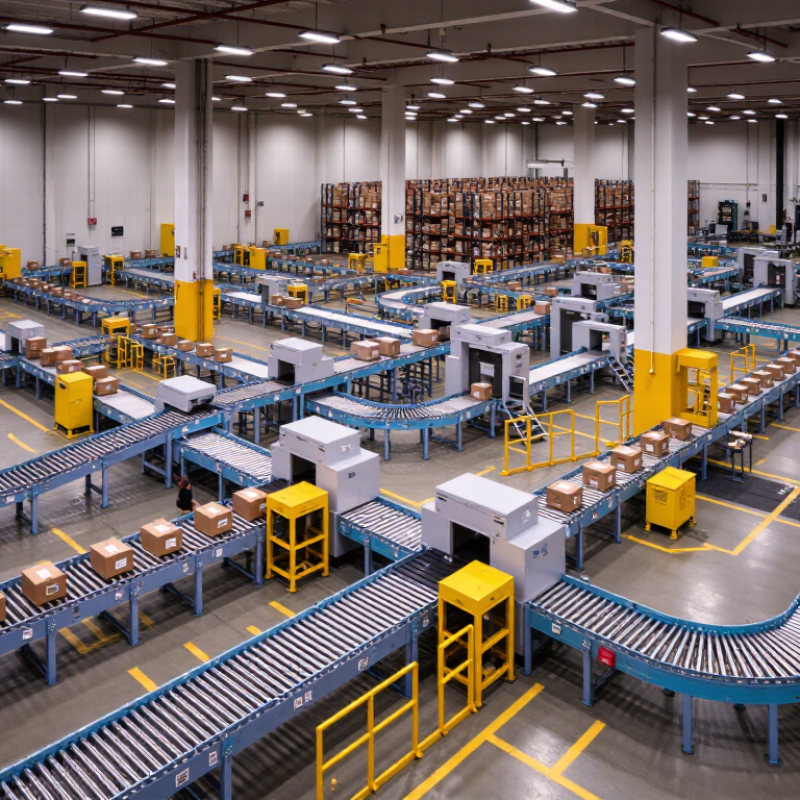
Define the load before comparing conveyor systems. Record each item’s dimensions, weight, shape, and packaging. Include the heaviest case, the smallest parcel, and any awkward items that may shift or snag. A sealed carton behaves differently from an open tote. Measure it twice. Don’t size the system around an average item alone; occasional oversize loads can cause frequent stoppages. Note how items arrive, too: gaps between cartons affect flow just as much as belt speed.
Map the full route, including bends, elevation changes, merges, and operator handoff points. Measure the available floor space and leave room for access, cleaning, and maintenance. Then define the duty cycle: operating hours per shift, shifts per day, and expected days in service. Peak matters. Calculate peak throughput in items per minute, not just the daily total, and account for short surges during order cutoffs or shift changes. Add a realistic buffer, but avoid choosing capacity from an optimistic forecast. Real shifts have pauses, uneven arrivals, and occasional jams. A simple worksheet based on observed loads and timed production samples can expose gaps in the estimate. Still, early measurements are imperfect; verify them during a representative busy period before finalizing the specification.
Calculate Bulk Capacity: Q = 3,600Avρ, with Q in t/h and ρ in t/m³
How to Choose the Best Automation Conveyor Systems?
Bulk capacity depends on three measurable inputs: loaded cross-sectional area, belt speed, and bulk density. Use Q = 3,600Avρ, where Q is tonnes per hour, A is square metres, v is metres per second, and ρ is tonnes per cubic metre. The Conveyor Equipment Manufacturers Association’s Belt Conveyors for Bulk Materials explains capacity estimation through load cross-section, speed, and material properties. Measure the area of material on the belt; belt width alone is not enough.
For example, A = 0.08 m², v = 2.0 m/s, and ρ = 1.6 t/m³ produce a theoretical capacity of 921.6 t/h. Treat this as a starting point, not a guaranteed operating rate. Uneven loading, moisture, particle size, and transfer-point losses can reduce actual throughput. Density also varies by material and condition, so a generic table may mislead. Small errors matter.
Tip: Measure bulk density from a representative sample, then check the loaded cross-section under normal operation. Compare the result with actual tonnes weighed over a timed run. If readings differ, investigate spillage, belt loading, and speed calibration before increasing the design capacity.
How to Choose the Best Automation Conveyor Systems? — Calculate Bulk Capacity
Estimate theoretical mass capacity with Q = 3,600 × A × v × ρ, where Q is capacity in t/h, A is the loaded material cross-sectional area in m², v is conveying speed in m/s, and ρ is bulk density in t/m³.
| Bulk Material |
Loaded Area, A (m²) |
Speed, v (m/s) |
Bulk Density, ρ (t/m³) |
Estimated Capacity, Q (t/h) |
| Wheat grain |
0.080 |
1.00 |
0.75 |
216 |
| Crushed gravel |
0.120 |
1.25 |
1.60 |
864 |
| Crushed limestone |
0.180 |
1.50 |
1.40 |
1,361 |
| Coal |
0.250 |
2.00 |
0.85 |
1,530 |
| Iron ore |
0.100 |
0.80 |
2.20 |
634 |
| Wood chips |
0.300 |
2.20 |
0.25 |
594 |
These examples are illustrative estimates using representative bulk-density values. Actual capacity depends on material grading, moisture, belt loading, conveyor inclination, and operating conditions. Confirm the material’s measured bulk density and allowable loading before selecting a system.
Check Conveyor Power and Belt Tension Using ISO 5048 Calculations
ISO 5048 calculations help compare conveyor options using measured resistance, belt speed, and material load.
Start with the actual layout: conveyor length, incline, belt mass, and the load carried per metre. A small incline can change the required pull more than expected. Check the idlers, too. Dirty or poorly aligned rollers add resistance.
The calculation estimates effective belt tension, then drive power. In simple terms, power in kilowatts is
effective tension in newtons multiplied by belt speed in metres per second, divided by 1,000.
Allow for drive efficiency when selecting motor power. The tight-side and slack-side tensions also matter. Together, they help assess whether the drive can transmit force without belt slip and whether the belt and take-up arrangement can handle the load.
Use operating data where possible, not just catalogue assumptions. Record belt speed, material flow, and any unusual drag during a loaded run. Keep an eye on take-up travel. A calculation can look tidy while a real belt wanders or slips. ISO 5048 provides a useful engineering method, but it does not capture every start-up condition or site-specific issue. Treat the result as a design check, then review it against actual operating conditions. Small details matter.
Compare Controls with OEE = Availability × Performance × Quality (ISO 22400)
How to Choose the Best Automation Conveyor Systems?
When comparing conveyor controls, look beyond dashboards and check how reliably they measure OEE: Availability × Performance × Quality. ISO 22400 provides a framework for defining and using manufacturing performance indicators. Availability reflects operating time against planned production time; performance compares actual output with the expected rate; quality tracks good units against total units. Keep these definitions consistent across systems, or the comparison can mislead.
Small details matter. A conveyor stopping for a blocked photoeye should be classified consistently, not counted as unexplained downtime.
Tips: Ask to see a sample shift report. Check whether operators can review stop reasons, output counts, and rejected items at the line. Clear records help teams spot recurring slowdowns.
Good controls gather usable data from sensors and counters, then show where losses occur. For example, a line may have strong availability but lose performance when cartons repeatedly queue at a transfer point. Another line may run steadily yet produce more damaged packages. OEE makes these patterns easier to discuss, but it does not explain every cause. That part takes investigation.
Compare systems using the same product mix, shift length, and target rate; otherwise, a neat chart may hide an unfair comparison. It is tempting to chase one high score. A better choice supports accurate measurement and helps staff act on what the numbers reveal.
Specify Guarding and Safety Functions Using OSHA 1910.212 and ISO 13849-1 PLr
How to Choose the Best Automation Conveyor Systems?
Specify Guarding and Safety Functions Using OSHA 1910.212 and ISO 13849-1 PLr
A suitable conveyor system begins with a documented hazard assessment, not motor speed alone. OSHA 1910.212 requires protection from points of operation, nip points, rotating parts, and other machine hazards. Fixed guards should prevent hand access while allowing cleaning and inspection. Interlocked access doors can stop hazardous motion when opened. However, an interlock is not automatically a complete safety solution.
ISO 13849-1 helps define the required Performance Level, or PLr, for each safety function. Consider injury severity, exposure frequency, and the possibility of avoiding danger. Typical functions may include stopping the belt when a gate opens, preventing unexpected restart, or monitoring emergency-stop circuits. The final design should verify achieved performance using architecture, MTTFd, diagnostic coverage, and common-cause failure controls.
Tips: Walk the conveyor route with operators. Measure reach distances around transfers and rollers. Test every guard during commissioning. Record reset locations clearly. Keep it practical.
Real installations often reveal overlooked hazards, especially at transfer points and under elevated conveyors. A guard may look secure but still allow fingers near a moving roller. This deserves another review. Safety devices should be validated under realistic conditions, including power recovery and sensor faults. OSHA compliance and ISO-based design support each other, but neither replaces site-specific engineering judgment, training, inspection, and maintenance.
How to Choose the Best Automation Conveyor Systems?
Specify guarding and safety functions using OSHA 1910.212 and ISO 13849-1 PLr. OSHA 1910.212 requires machine guarding against hazards such as points of operation, nip points, rotating parts, and flying chips. ISO 13849-1 assigns a required Performance Level (PLr) through risk assessment; the chart shows the PFHd boundaries associated with each PL.
Conveyor safety functions to evaluate: fixed guards for accessible nip points, interlocked access guards, emergency-stop devices, and protective devices that stop hazardous movement. The final PLr must be determined from the actual severity, frequency of exposure, and possibility of avoiding the hazard.